ES & NQ EXECUTION FRAMEWORK

New York Session Trading Playbook

A structured educational framework for mapping ES and NQ context, observing New York session price discovery, and planning risk before execution.

This playbook explains an educational trading process. It does not provide trade signals, investment advice or guaranteed outcomes.
Session Architecture

New York Session Framework

The BokaroTraderFx framework focuses primarily on S&P 500 E-mini (ES) and Nasdaq 100 E-mini (NQ) futures. The New York cash-session open at 9:30 AM Eastern Time (ET) serves as the primary execution reference. Rather than predicting market direction prior to confirmation, the objective is to observe price acceptance, rejection, and liquidity behaviour around predefined structural levels.

Price Discovery Window

Opening Range — First 15 Minutes

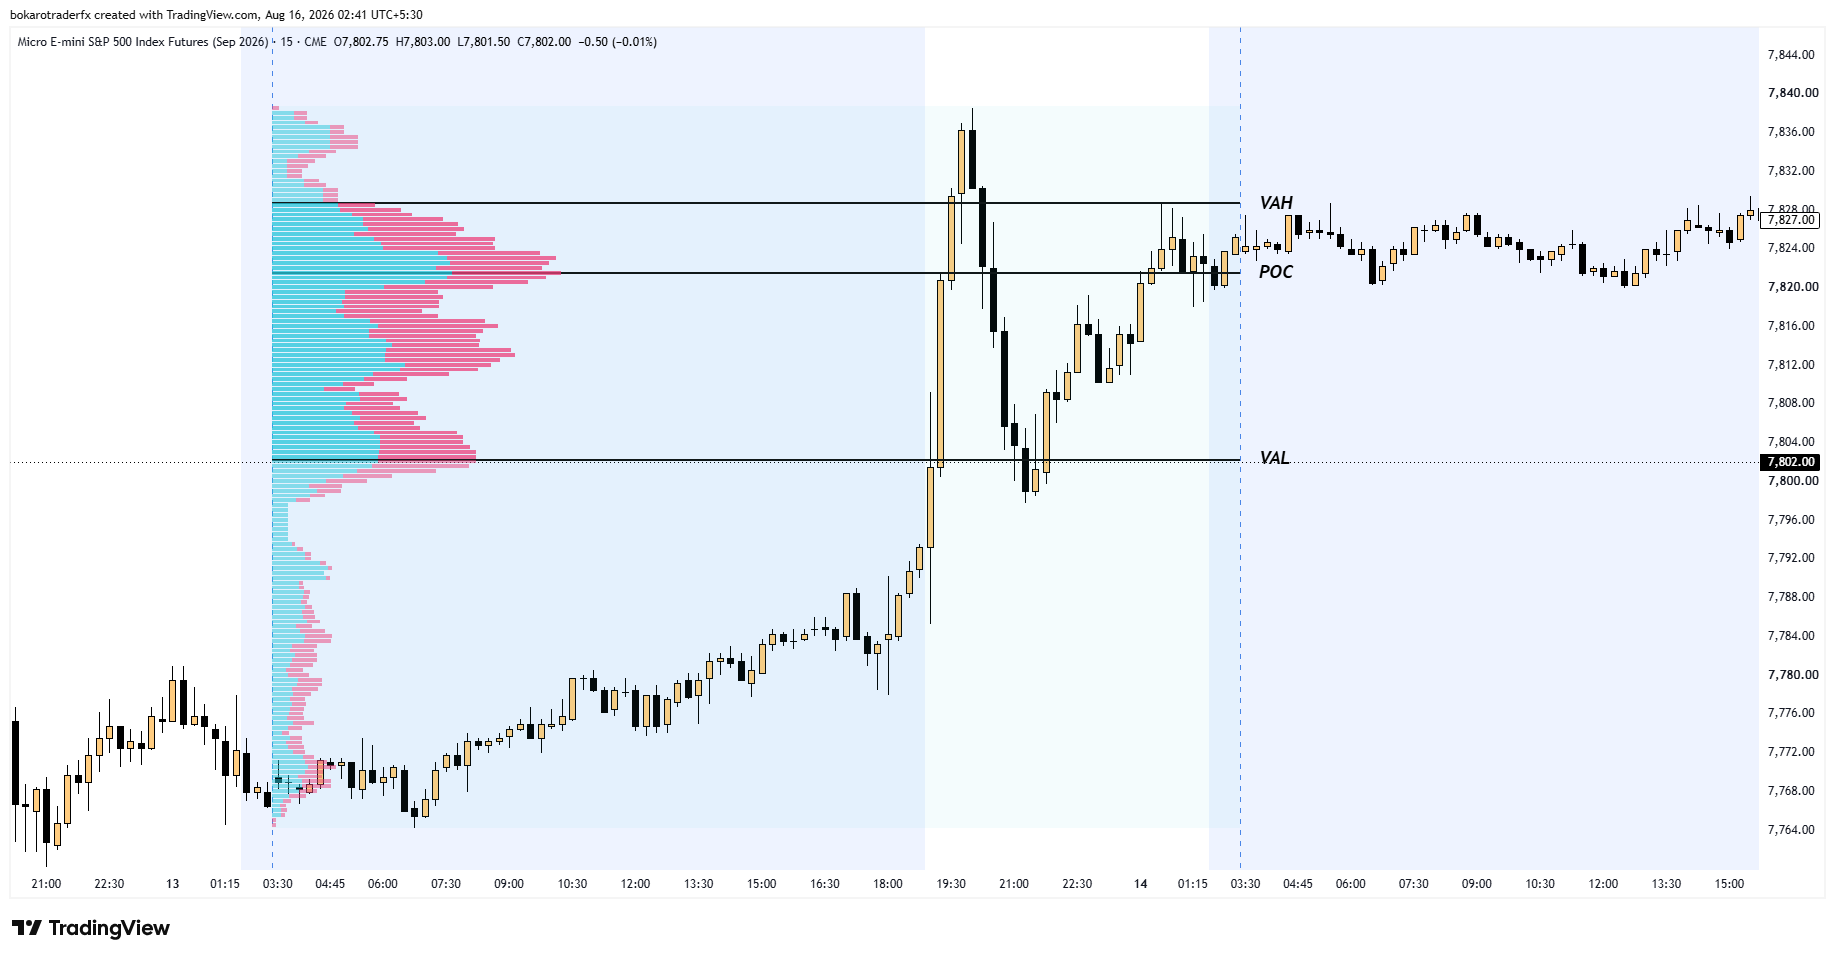
The Opening Range (OR15) is the ES/NQ price range established during the first 15 minutes of the New York cash session (9:30 AM to 9:45 AM ET). We mark the OR15 High, OR15 Low, and OR15 Midpoint. The initial breakout of this range is never an automatic entry signal; instead, we observe how market participants interact with the boundaries.

Acceptance

Price breaks outside the OR15 boundary and establishes sustained trading volume and new value outside the range.

  • Consecutive candle closes beyond boundary
  • VWAP slope and volume confirm participation
  • Pullbacks to broken boundary hold as support/resistance

Rejection

Price attempts to push beyond OR15 but fails to find follow-through, rapidly rotating back inside the opening structure.

  • Sharp tails or wicks leaving boundary levels
  • Failure to sustain volume above/below the extreme
  • Price may rotate toward the opposite boundary when rejection remains sustained.

Liquidity Sweep

Price pierces the OR15 high or low to trigger resting stops and access resting liquidity before aggressively reclaiming the range.

  • Absorbed aggressive breakout volume on Bookmap
  • Immediate structural reclaim of OR15 boundary
  • Can help define a structural invalidation point when a reclaimed boundary is used in the trade plan.
Process Discipline: Breakouts must always be cross-referenced with VWAP positioning, Volume Profile value distribution, and order-flow absorption. OR15 is an observational benchmark, not a guaranteed breakout trigger.
ES one-minute chart showing the New York opening range high and low from 9:30 AM to 9:45 AM Eastern Time
OR15 example: the high and low formed during the first 15 minutes after the New York cash open. Chart created by BokaroTraderFx using TradingView.
Session Benchmarks

Three VWAP References

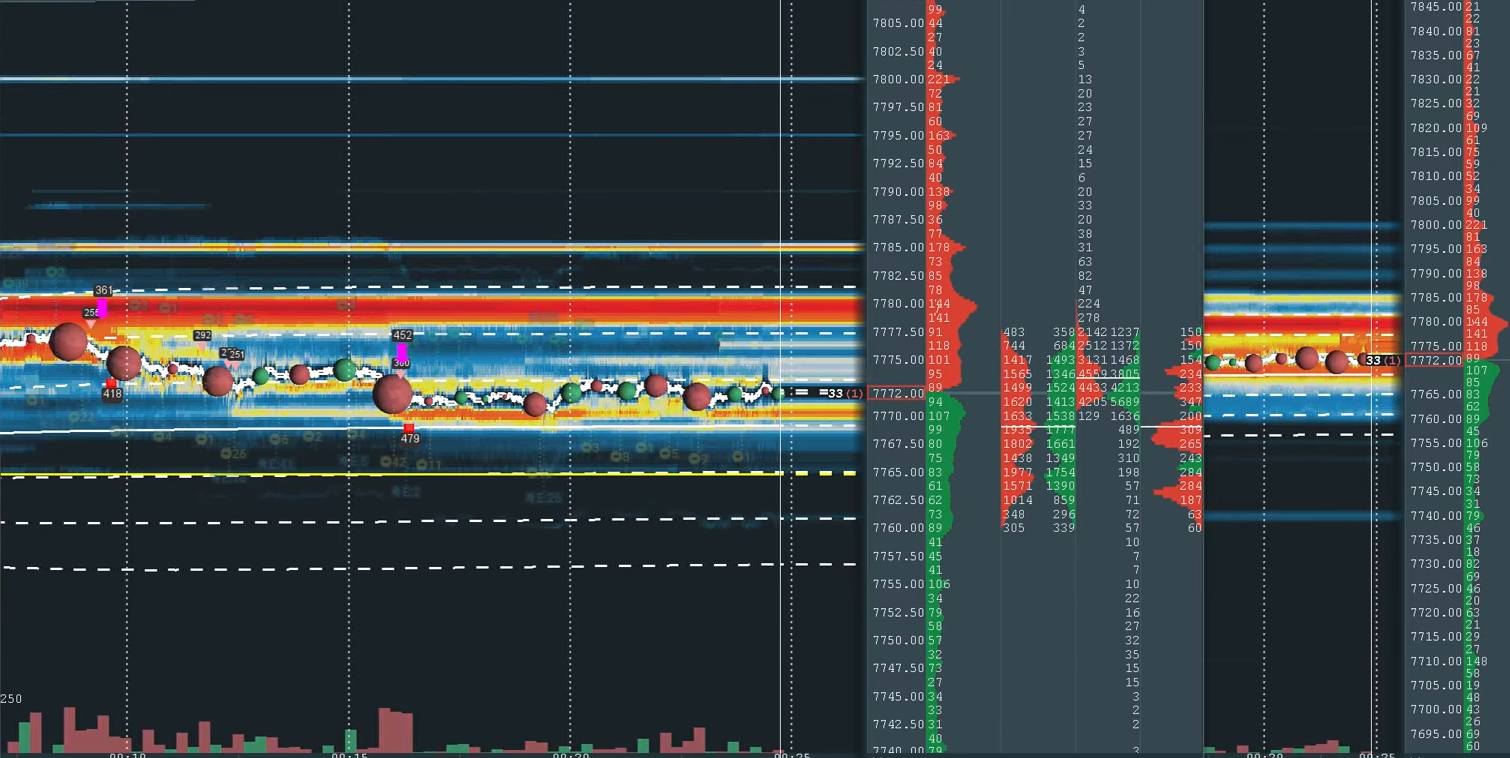
Volume-Weighted Average Price (VWAP) represents the benchmark average price a security has traded at throughout a specific timeframe based on both volume and price. BokaroTraderFx evaluates three distinct VWAP references:

ES/NQ Globex Daily VWAP

Overnight VWAP
Anchor Point
6:00 PM ET (3:30 AM IST DST / 4:30 AM IST ST)
Analytical Purpose
Measures the volume-weighted average across the CME Globex trading day and provides the primary overnight session reference.
Reset / Continuity
Resets daily at the CME Globex session start (6:00 PM ET) and runs until 5:00 PM ET the next day.
NY Open VWAP

Anchor Point
9:30 AM ET (7:00 PM IST DST / 8:00 PM IST ST)
Analytical Purpose
Measures participation and price behaviour beginning from the New York cash-session open.
Reset / Continuity
Anchors fresh at 9:30 AM ET every trading day.

PDNY VWAP

Previous-Day NY Open
Anchor Point
Previous trading day at 9:30 AM ET
Analytical Purpose
Carries the previous New York session’s NY Open VWAP into the current session for comparison and context.
Reset / Continuity
Remains a static historical reference during the current trading session.
Unified Reference Note: The ES/NQ Globex Daily VWAP and the Overnight VWAP are the exact same indicator line in this framework, anchored at the 6:00 PM ET Globex session open. They are not separate calculations.
Critical Evaluation Notice: VWAP positioning alone is not an entry signal. It is evaluated strictly alongside OR15 structure, Volume Profile value distribution, price acceptance/rejection, and order-flow behaviour.
ES chart showing Globex Daily VWAP, New York Open VWAP and Previous-Day New York Open VWAP
Three VWAP references used for session context. Chart created by BokaroTraderFx using TradingView.
Structural Value Analysis

Volume Profile Context

Volume Profile plots trading activity over a specified time period at specified price levels. It reveals where the market established value (high volume) and where price moved quickly through imbalance (low volume).

Value Area Core

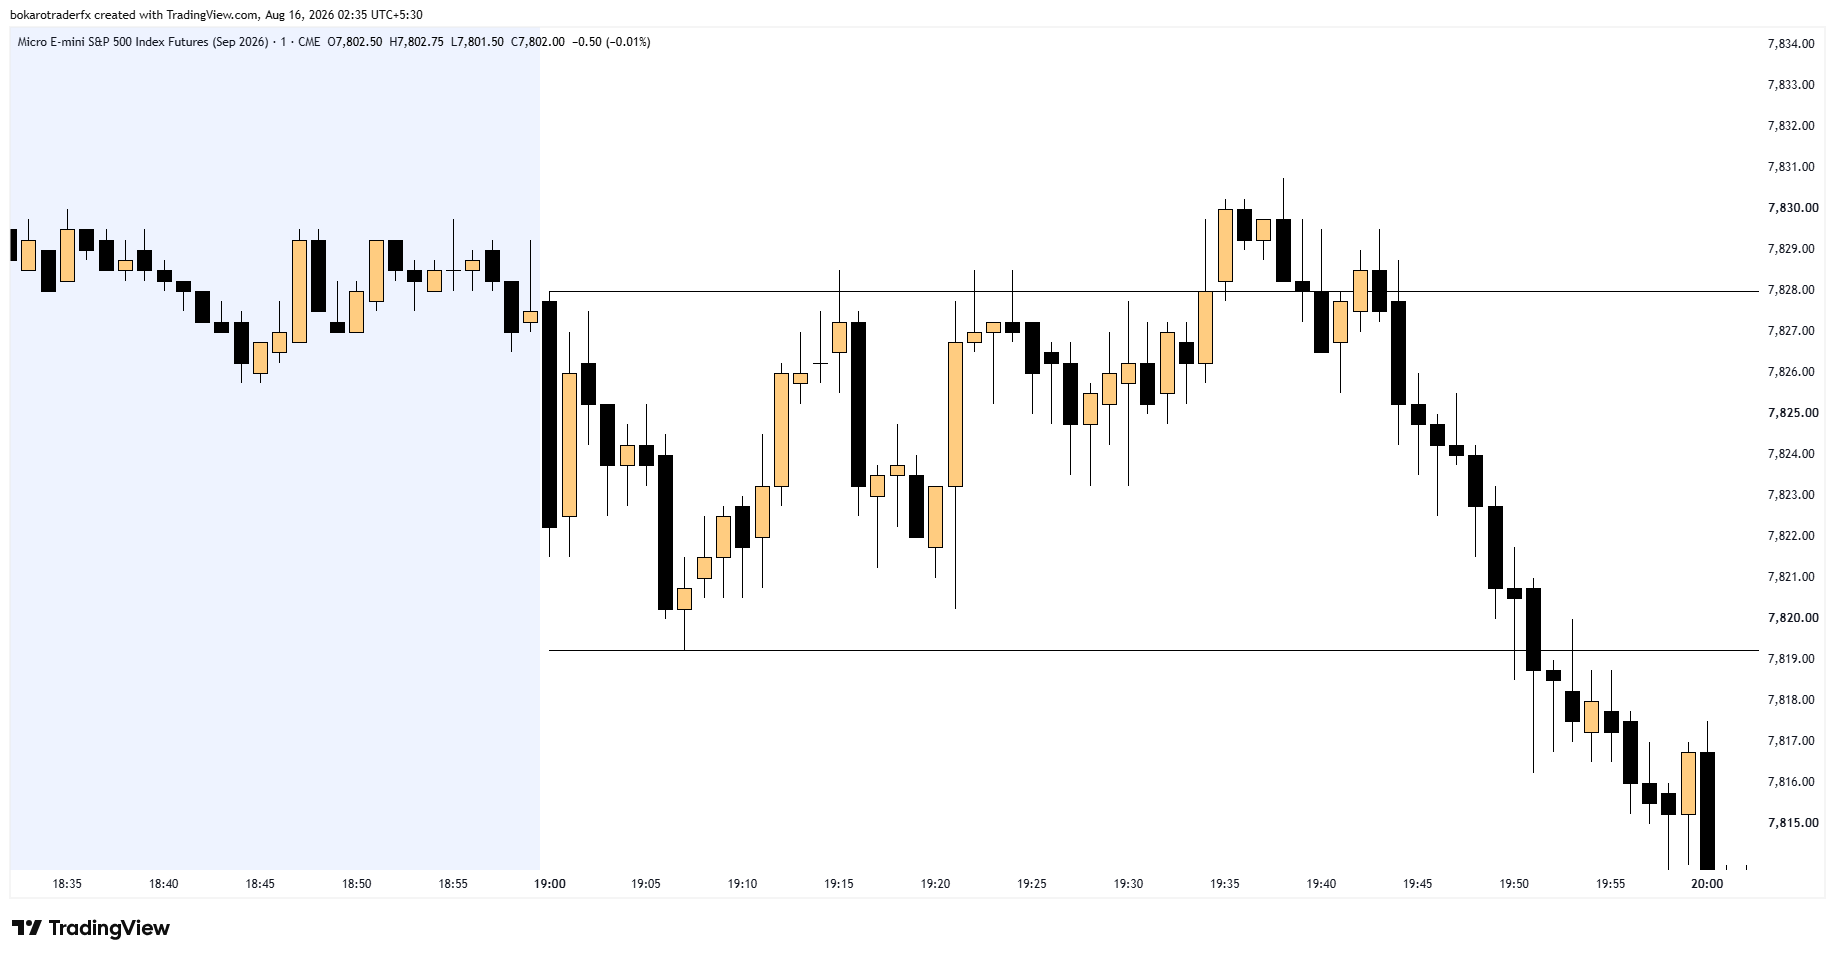
Point of Control (POC): The single price level with the highest traded volume during the session. May attract repeated price interaction because it represents the session’s highest-volume price level.

Value Area (VA): The price range where 70% of the session's total volume was transacted, bounded by Value Area High (VAH) and Value Area Low (VAL).

Node Dynamics

High-Volume Nodes (HVN): Clusters of heavy transaction volume where price found two-way agreement. HVNs show areas where substantial two-way trade previously occurred; future price behaviour at these areas remains uncertain.

Low-Volume Nodes (LVN): Price zones where very little volume was transacted. LVNs identify areas where comparatively little volume traded; price may either move through them quickly or reject them.

Structural Alignment

Volume Profile levels are systematically aligned with other reference markers:

  • Globex Daily VWAP, NY Open VWAP & PDNY VWAP
  • Opening Range (OR15) High & Low
  • Overnight High/Low (ONH/ONL) & Prior Day High/Low (PDH/PDL)
Neutral Interpretation: Volume Profile outlines historical auction agreements and liquidity distribution. No profile node or boundary constitutes guaranteed support or resistance.
ES Volume Profile chart identifying Value Area High, Point of Control and Value Area Low
Volume Profile example identifying VAH, POC and VAL. Chart created by BokaroTraderFx using TradingView.
Microstructure Confirmation

Bookmap Order-Flow Confirmation

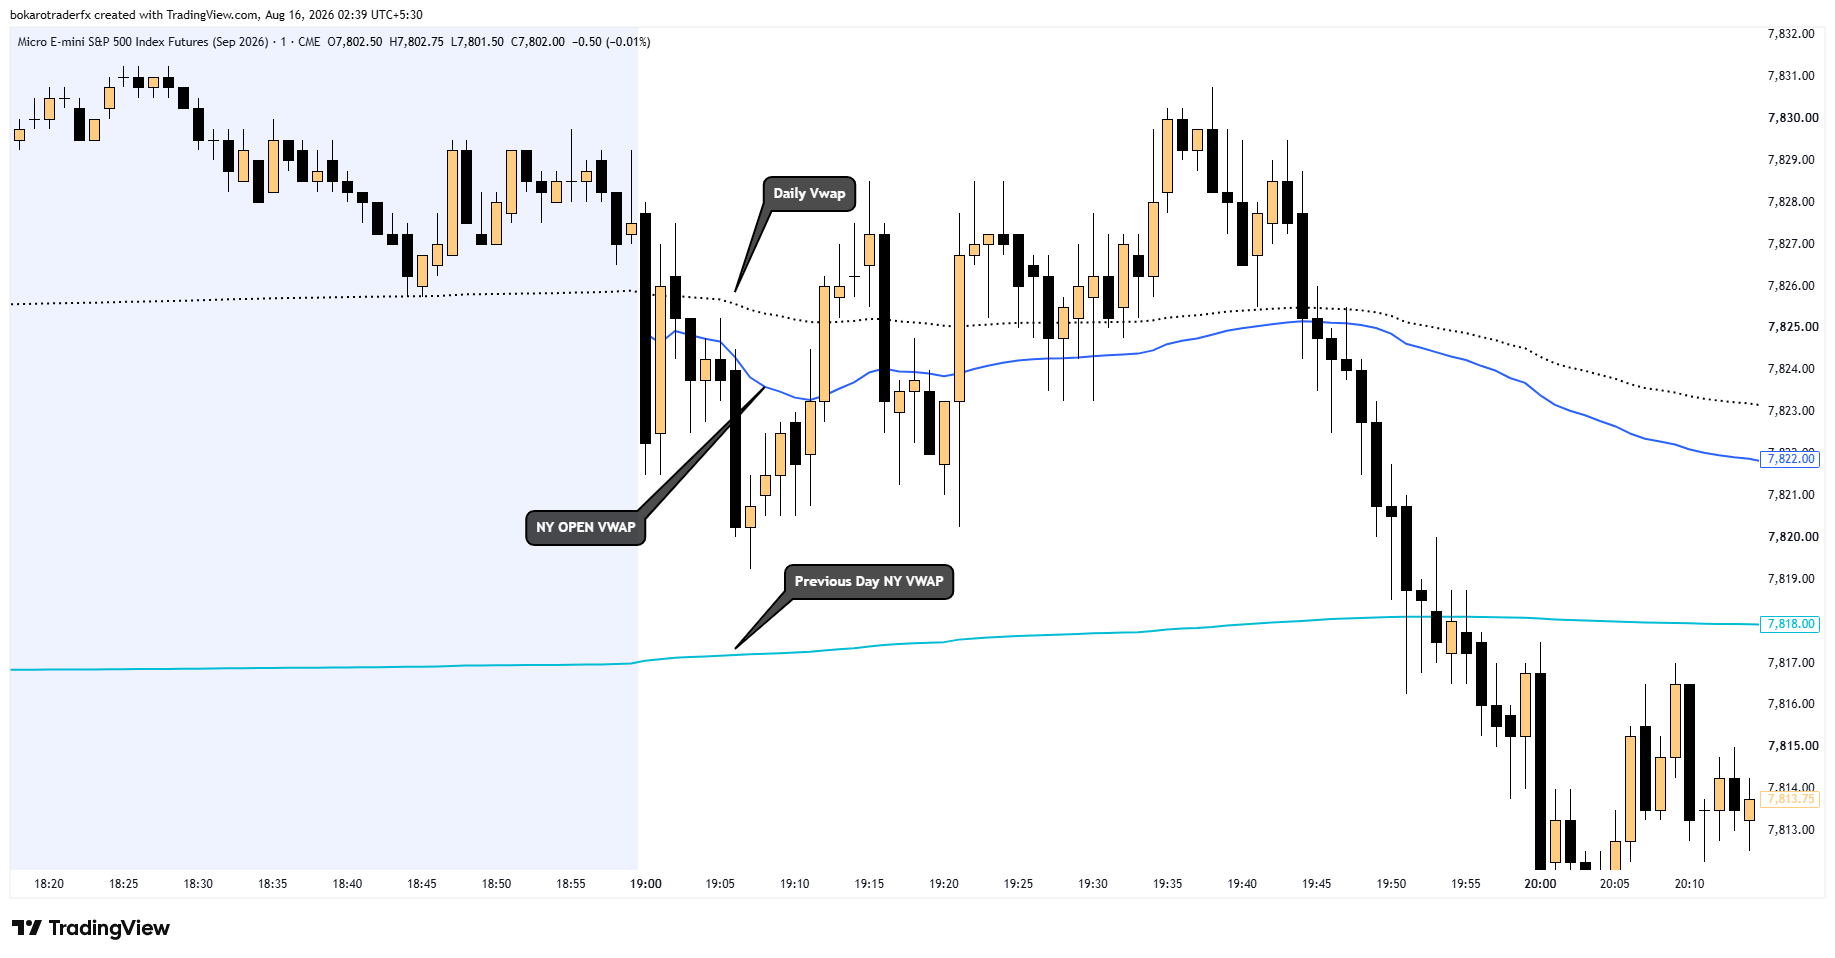
Bookmap provides real-time visual representation of market depth (Limit Order Book) and executed volume. In this playbook, order flow is utilized exclusively as an observation and confirmation layer around previously established structural levels.

Limit Order Book (Liquidity Heatmap)

Resting Liquidity: Identifies significant resting buy and sell limit orders placed in the order book. Highlights potential auction target levels and price friction zones.

Liquidity Pulling & Adding: Evaluates whether resting orders are genuinely held to provide liquidity or pulled before price arrival (spoofing/repositioning).

Execution Aggression & Absorption

Aggressive Volume: Visualizes market buy and market sell orders consuming resting liquidity across the price ladder.

Absorption: Occurs when heavy aggressive market orders hit a key level but price fails to advance due to overwhelming passive limit liquidity. May support an exhaustion or reversal interpretation when aligned with predefined structure and price confirmation.

Third-Party Platform Disclosure: Bookmap is an independent third-party market-visualization platform. BokaroTraderFx is not affiliated with, sponsored by, or claiming guaranteed predictive accuracy through Bookmap software.
Bookmap order-flow heatmap showing resting liquidity, executed volume bubbles and absorption around key levels
Order-flow heatmap example used to observe resting liquidity, aggressive volume and absorption. Bookmap is an independent third-party platform.
Disciplined Workflow

Structured Execution Sequence

A consistent trading process depends on following a structured, repeatable sequence for every execution. We separate the process of mapping, waiting, confirming, executing, and reviewing into six clear steps:

1

Map Context

Establish structural landscape prior to New York cash open. Mark Previous-Day High/Low (PDH/PDL), Overnight High/Low (ONH/ONL), Globex Daily VWAP, current NY Open VWAP, PDNY VWAP, and key Volume Profile value areas.

PDH / PDL ONH / ONL 3 VWAP References Volume Profile Nodes
2

Define Opening Structure

Observe initial auction dynamics following the New York cash open. Establish OR15 (9:30–9:45 AM ET) boundaries, assess early opening volatility, and monitor price acceptance, rejection, and liquidity behaviour around the opening range.

New York Cash Open OR15 Boundaries Opening Volatility Liquidity Behaviour
3

Wait for Interaction

Patiently wait for price to reach a predefined level of interest. Observe the price action interaction: Acceptance beyond boundary, Rejection back inside, Structural Reclaim, Liquidity Sweep, or Retest of a key node.

Level Interaction Acceptance / Rejection Sweep & Reclaim
4

Seek Multi-Layer Confirmation

Validate the setup across multiple lenses: candle structural confirmation, Volume Profile value reaction, and Bookmap order-flow absorption or liquidity migration. Never enter on the signal of a single isolated indicator.

Structural Confluence Volume Confirmation Order-Flow Absorption
5

Define Risk Before Entry

Plan trade parameters mathematically before submitting an order. Identify exact entry price, structural invalidation point, stop-loss distance, calculated position size, and target profit objective.

Invalidation Point Calculated Sizing Max 1% Planned Risk
6

Review & Journal the Trade

Log the execution in the trading journal. Record screenshot, session context, checklist adherence, and emotional state. Separate execution process quality from monetary outcome to foster continuous learning.

Trade Journaling Process Evaluation Mistake Attribution
Session Reference

ES & NQ Session Timing Reference

Use Eastern Time as the canonical market reference and verify the corresponding IST schedule during daylight-saving and standard-time periods.

Canonical Timezone Reference: All market operations in US index futures are anchored in Eastern Time (ET). Because daylight-saving time shifts the offset between North America and India (IST), tracking canonical ET ensures structural consistency across seasonal clock changes.
Session / Milestone Eastern Time (ET) US Daylight Saving (DST) — IST US Standard Time (ST) — IST
CME Globex ES/NQ Session 6:00 PM – 5:00 PM (Next Day) 3:30 AM – 2:29 AM (Next Day) IST 4:30 AM – 3:29 AM (Next Day) IST
Daily Exchange Maintenance 5:00 PM – 6:00 PM ET 2:30 AM – 3:29 AM IST 3:30 AM – 4:29 AM IST
New York Cash Open 9:30 AM ET 7:00 PM IST 8:00 PM IST
Opening Range 15 (OR15) 9:30 AM – 9:45 AM ET 7:00 PM – 7:15 PM IST 8:00 PM – 8:15 PM IST

During US Daylight-Saving Time (DST)

  • Globex Session: 3:30 AM IST to 2:29 AM IST the next day
  • Maintenance Window: 2:30 AM – 3:29 AM IST
  • New York Cash Open: 7:00 PM IST
  • Opening Range (OR15): 7:00 PM – 7:15 PM IST

During US Standard Time (ST)

(Each IST time shifts exactly one hour later)

  • Globex Session: 4:30 AM IST to 3:29 AM IST the next day
  • Maintenance Window: 3:30 AM – 4:29 AM IST
  • New York Cash Open: 8:00 PM IST
  • Opening Range (OR15): 8:00 PM – 8:15 PM IST
Schedule Disclosures: Exchange holidays, early market closes, contract roll dates, and special economic releases can change normal trading hours. Always verify active CME Globex schedules before executing.
Capital Preservation First

Risk Comes Before Execution

Long-term consistency in financial markets is built upon strict risk management rules. No strategy or analytical tool eliminates market uncertainty or financial risk.

Core Risk Rules

  • Maximum 1% Planned Risk: Never risk more than 1% of total account equity on any single execution. Lower risk on uncertain or volatile sessions.
  • Invalidation-Based Sizing: Calculate contract/lot sizing strictly from the distance to your structural invalidation level, never from arbitrary dollar amounts.
  • No Stop Widening: Never move or widen a stop loss during an active trade to avoid realizing a loss.

Psychological Boundaries

  • Zero Revenge Trading: Avoid repeated or impulsive entries immediately following a stopped-out trade.
  • Predefined Daily Loss Limits: Stop trading for the remainder of the session once your maximum daily loss threshold is reached.
  • Accepting Probabilities: Every individual trade carries an independent outcome. Adhering to process preserves mental and financial capital.